Colormaps & palettes
Every colour helper resolves by name: cmap() for continuous
colormaps, categorical() for class-code rasters,
qualitative() and
artist_palette() for lists of distinct colours.
Unknown names raise KeyError. Examples that draw set the house style with
nf.set_theme("paper").
Resolving continuous colormaps
DEFAULTS maps a kind of data to a colormap.
cmap(name, n=None) resolves such a kind, a matplotlib name (case-insensitive)
or a Colormap, and resamples it to n levels if asked:
import nicefigs as nf

print(nf.DEFAULTS["diverging"], nf.DEFAULTS["intensity"])
print(nf.cmap("spectral_r").name)
print(nf.cmap("diverging").name)
print(nf.cmap("viridis", n=8).N)
Name a kind ("diverging", "sequential", "cyclic") rather than a
colormap, and every figure of one kind changes together.
Centring diverging data
For anomalies centred on a meaningful value,
symmetric_limits() returns (-m, m) from a
robust percentile of |values|, robust_limits()
returns percentile limits, and diverging_norm()
builds a TwoSlopeNorm around center:
import numpy as np

import nicefigs as nf

anomaly = np.random.default_rng(0).normal(0.3, 1.0, 5000)
lo, hi = nf.symmetric_limits(anomaly)
norm = nf.diverging_norm(lo, hi, center=0.0)
print(f"{lo:.2f} {hi:.2f}", f"{norm(0.0):.2f}")
print([f"{v:.2f}" for v in nf.robust_limits(anomaly)])
Zero maps to the middle of the colormap even though the data are skewed.
map(..., diverging=True) uses the same limits.
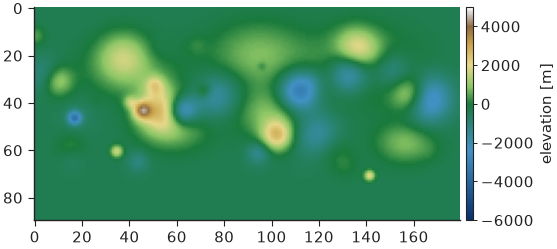
Elevation colormap
elevation_cmap() returns a hypsometric
(cmap, norm) pair — blues below sea_level, green to tan to white above —
with the norm placing sea_level exactly at the land/sea break for any
vmin/vmax:
import nicefigs as nf
from nicefigs import data

nf.set_theme("paper")

elevation = data.elevation_field(shape=(90, 180))
cmap, norm = nf.elevation_cmap(vmin=-6000, vmax=5000)
fig, ax = nf.subplots(width="half", aspect=0.55)
im = ax.imshow(elevation, cmap=cmap, norm=norm)
nf.colorbar(im, ax, label="elevation [m]")
print(f"{norm(0.0):.3f}")
Banded scorecard colormap
scorecard_diverging_cmap() returns a
(cmap, norm) pair for percent differences: 11 discrete, quasi-logarithmic
bands over SCORECARD_DIVERGING_BOUNDARIES,
a light-grey centre band, and distinct colours beyond ±50 %:
import numpy as np

import nicefigs as nf

nf.set_theme("paper")

cmap, norm = nf.scorecard_diverging_cmap()
print(nf.SCORECARD_DIVERGING_BOUNDARIES)
pct_diff = np.random.default_rng(1).normal(0, 15, (4, 6))
fig, ax = nf.subplots(width="half", aspect=0.6)
im = ax.imshow(pct_diff, cmap=cmap, norm=norm)
ax.set_axis_off()
nf.colorbar(im, ax, extend="both", label="difference [%]")
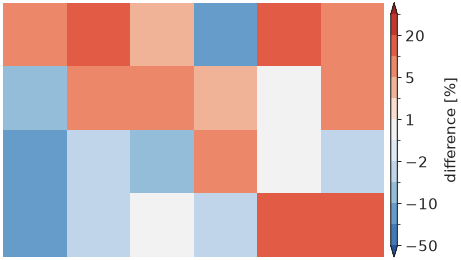
The narrow bands near zero keep differences of a few percent apart, where a linear ±100 % scale would render them all as near-white.
Land-cover palettes
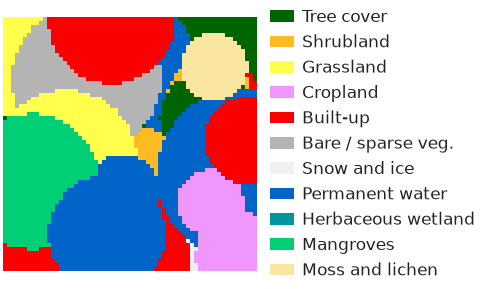
categorical(name) returns a
Categorical — class codes mapped to names and colours
— from CATEGORICAL: "esa_worldcover",
"esri_lulc" and "modis_igbp". It gives a (cmap, norm) pair for
imshow, an RGB image, and legend patches:
import nicefigs as nf
from nicefigs import data

nf.set_theme("paper")

lc = nf.categorical("esa_worldcover")
codes = data.landcover_patch(size=64)
cmap, norm = lc.cmap_norm()
fig, ax = nf.subplots(width="half", aspect=0.6)
ax.imshow(codes, cmap=cmap, norm=norm)
ax.set_axis_off()
ax.legend(handles=lc.legend_handles(), loc="center left", bbox_to_anchor=(1.0, 0.5),
          frameon=False, fontsize=6)
print(sorted(nf.CATEGORICAL), lc.to_rgb(codes).shape)
Qualitative and artist palettes
qualitative(n, palette="nice") returns n distinct
colours, cycling past the palette length. The default "nice" palette
(NICE) is a bright teal ahead of colours sampled from David
Hockney's A Bigger Grand Canyon; it is also every theme's colour cycle.
"bright", "muted" and "high_contrast" are Paul Tol's colour-blind-safe
palettes, and ARTIST_PALETTES adds palettes from
MetBrewer and
MoMAColors:
import nicefigs as nf

print(nf.qualitative(3))
print(nf.qualitative(3, "bright"))
print(nf.artist_palette("hiroshige", 4))
print(len(nf.ARTIST_PALETTES))
['#25c5a6', '#ef5a1c', '#9a4fbc']
['#4477AA', '#EE6677', '#228833']
['#e76254', '#ef8a47', '#f7aa58', '#ffd06f']
27
Each artist palette is also registered as a continuous colormap, built by
artist_cmap() and resolvable through cmap:
import numpy as np

import nicefigs as nf

nf.set_theme("paper")

fig, axes = nf.subplots(3, 1, width="half", aspect=0.45, hspace=1.2)
gradient = np.linspace(0, 1, 256)[None, :]
for ax, name in zip(axes, ["nice_teal", "hockney_canyon", "hiroshige"]):
    ax.imshow(gradient, aspect="auto", cmap=nf.cmap(name))
    ax.set_title(name, loc="left", fontsize=6)
    ax.set_axis_off()
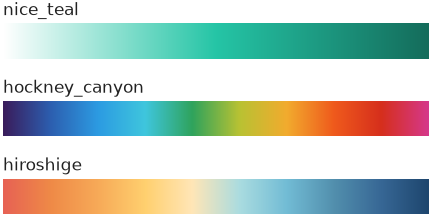
nice_teal, nice_orange and nice_purple are white-to-colour ramps for
density shading in the house colours.
Ternary colour encoding
A composition (a, b, c) with a + b + c = 1 becomes a colour by blending
three corner colours barycentrically with
ternary.color(). It underlies
ternary_scatter(),
ternary_map() and
ternary_image(). corners takes three colours or
a name from TERNARY_PALETTES:
import nicefigs as nf
from nicefigs import data

nf.set_theme("paper")

print(sorted(nf.TERNARY_PALETTES))
comp, _ = data.ternary_points(n=300)
ax, _ = nf.ternary_scatter(comp, corners="bright", labels=("A", "B", "C"))
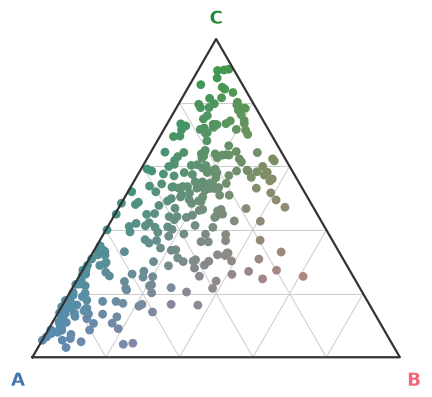
A pure component takes its corner colour; an even mix tends to grey.
Bivariate colormaps
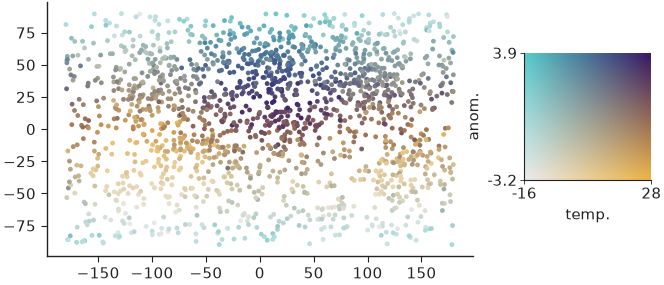
When two continuous variables share one plot, a 2-D colormap encodes both.
colormaps2d maps (x, y) in [0, 1]² to RGB with
bivariate_cmap() (four blended corners),
hsv_cmap() (hue × saturation) or
flat_cmap() (constant CIE-Lab lightness), each with a
matching legend. normalize01() rescales
raw values (5th–95th percentile by default) and returns the range for the
legend ticks:
import nicefigs as nf
from nicefigs import data
from nicefigs.colormaps2d import normalize01

nf.set_theme("paper")

lon, lat, temp = data.global_points(field="temperature")
_, _, anom = data.global_points(field="anomaly")
tx, trange = normalize01(temp)
ay, arange_ = normalize01(anom)
fig, ax = nf.subplots(width="half", aspect=0.6)
ax.scatter(lon, lat, c=nf.bivariate_cmap(tx, ay), s=3, linewidths=0)
iax = ax.inset_axes([1.12, 0.3, 0.3, 0.5])
nf.bivariate_legend(iax, x_label="temp.", y_label="anom.", x_range=trange, y_range=arange_)
Note
A bivariate colormap is hard to read precisely; use it to show where two variables co-occur, and give exact values in a separate panel.